
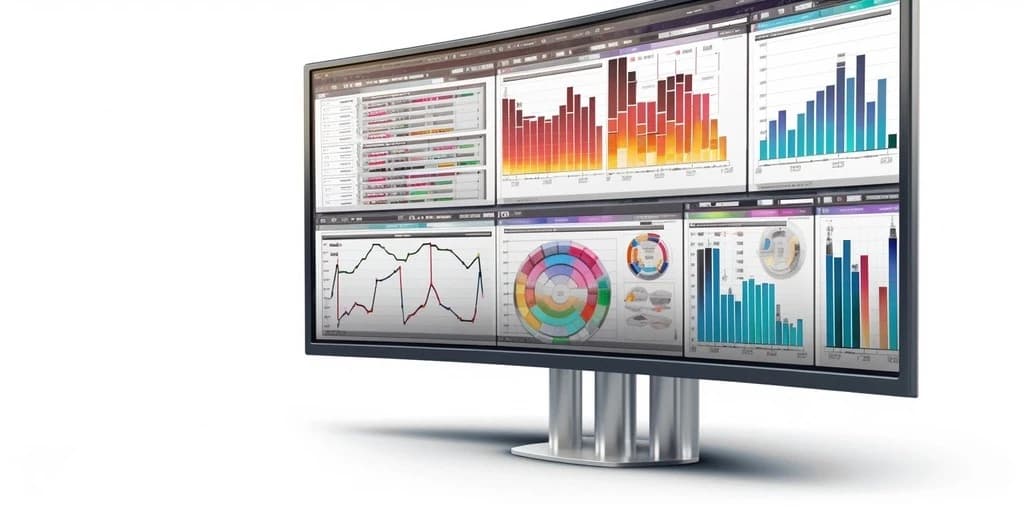
Position maps (liquidity heatmaps) reveal where large institutional players place their stop-loss and limit orders. By identifying these “hidden” zones, traders can anticipate market reversals and breakout points with higher precision.
Market Analysis & Strategy for Position Maps Trading
In 2026, institutional liquidity is increasingly concentrated in specific price bands. Unlike traditional candlestick analysis, position maps visualize the depth of the market.
The Concept
Position maps aggregate open interest, pending limit orders, and stop-loss clusters.
Strategy (The “Liquidity Trap”)
Institutional algorithms often push price toward these high-liquidity zones to fill their own orders before reversing. Traders use this by looking for “Liquidity Sweeps” – price moving past a zone, triggering stops, and immediately reversing.
Essential Position Sizing: Risk Management for Liquidity Traders
Even the most accurate position map cannot predict 100% of market outcomes. To protect your capital, you must align your entry with strict risk math.
The Formula:
To calculate your position size, use the following logic: Position Size = (Account Balance × Risk %) ÷ (Stop-Loss distance in pips × Pip Value)
- Risk per Trade: We recommend a maximum of 1% to 2% of your total account balance per trade.
- Stop-Loss Placement: Your stop-loss (SL) should be based on the map’s liquidity data, not arbitrary pips. Place it just beyond the “Liquidity Wall” you identified, adding a 5–10 pip buffer to account for institutional volatility (the “stop-hunt”).
Position Map Example Scenario:
- Account Balance: $10,000
- Risk per Trade (1%): $100
- Distance to SL (based on map wall): 20 pips
- Calculation: $100 ÷ 20 pips = $5 per pip.
- Result: You should open a position size that equates to $5 per pip (e.g., 0.5 lots on a standard EUR/USD pair).
Pro Tip: If your stop-loss calculated from the liquidity map is too wide (e.g., 50+ pips), it means your risk is too high. Reduce your lot size proportionally to ensure your dollar-value risk remains constant at 1–2%. Never adjust your stop-loss closer just to “fit” a larger lot size – this is the fastest way to get stopped out by institutional noise.
Trading Specifications
How to Trade FX Using Position Maps: Step-by-Step Application
Follow this systematic approach to integrate position mapping into your daily Forex workflow.
Step 1. Identify Key Liquidity Zones
Open your market depth tool or heatmap at the start of the London or New York session. Look for the “hot” zones (the brightest clusters on the map) that represent the densest concentration of pending orders.
Step 2. Analyze Trend Context
Overlay the liquidity zones on your higher-timeframe chart (H4 or Daily). A liquidity wall located at a major support or resistance level is significantly more potent than one in the middle of a consolidation range.
Step 3. Wait for the “Liquidity Sweep” (The Confirmation)
Never “front-run” a liquidity wall. Wait for price to touch the zone, trigger the orders (you will see a spike in volume), and then watch for a reaction. The ideal signal is a “Wick Rejection” (price punches through the wall and closes back inside).
Step 4. Execute the Trade
Place your entry as soon as price confirms the rejection. Your stop-loss should be placed just outside the liquidity zone (on the “safer” side) to avoid being caught in the institutional stop-run.
Step 5. Manage with Trailing Stops
As price moves in your direction, move your stop to break-even once the next liquidity node is breached. This ensures you lock in profits while allowing the move to run until the next supply/demand cluster.
Real-World Position Map Trading Examples
- Scenario A (The Reversal): Price approaches a visible “Buy Wall” on the position map. Instead of breaking through, the volume drops off, and a bull candle forms. This indicates institutional accumulation.
- Scenario B (The Stop-Run): Price spikes through a well-known support level. The position map shows massive stop-loss liquidation below that level. Smart money uses this liquidity to exit shorts or enter longs at a better price.
Common Mistakes to Avoid
- Over-reliance on Heatmaps: Maps show potential, not guaranteed actions. Always confirm with price action.
- Ignoring News Volatility: High-impact news can blast through even the densest liquidity walls.
- Lack of Context: A liquidity wall alone is not a signal; combine it with trend analysis and volatility metrics.
Expert FAQ
Are Position Maps the same as Volume Profile?
No, though related. Profile shows volume traded; maps show volume queued (pending).
Where can I find these maps?
Professional platforms (like those for ECN traders) provide L2 data feeds that generate these visualizations.
Do I need an ECN account?
It is highly recommended. Market Maker feeds lack the depth data needed for accurate mapping.
Glossary
- Liquidity Sweep: A rapid move that triggers stops and reverses.
- Order Flow: The sequence of buy/sell orders in the LOB (Limit Order Book).
- Stop Run: Institutional pushing of price to hit stop-losses of retail traders.
Ready to Trade with Professional Liquidity Data?
Don’t trade in the dark. Experience institutional-grade execution and see where the market is actually moving. Join Headway today and get access to the tools you need to stay ahead of the order flow.


