

The Market Facilitation Index (MFI) helps traders analyze how efficiently price moves in relation to trading volume. Developed by Bill Williams, this indicator provides valuable insights into market sentiment, trend strength, and potential turning points. In this article, we will explain what the MFI is, how it is calculated, how to interpret its color codes, and how to apply practical trading strategies to use it effectively.
What is the Market Facilitation Index?
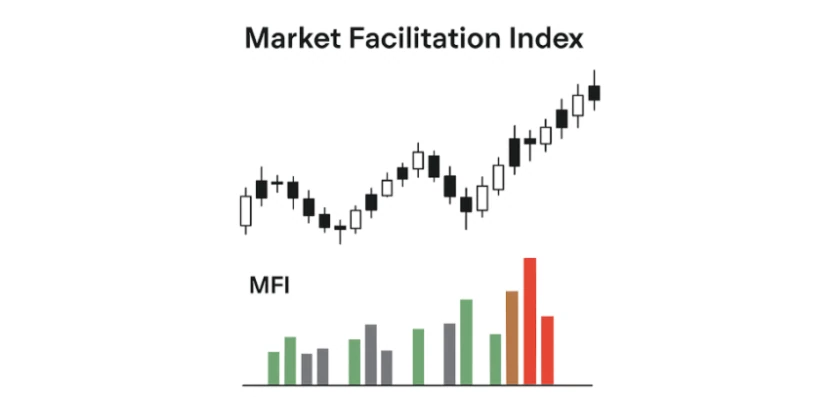
The Market Facilitation Index is a momentum indicator that measures the price movement per unit of volume during a specific period. In simple terms, it shows how much the price is moving relative to the trading volume behind that move.
The calculation formula is straightforward:
MFI = (High–Low) / Volume
- High–Low refers to the price range of the current candle (the difference between the highest and lowest price in that period).
- Volume is the total traded volume during that period.
Unlike indicators that focus solely on price or volume separately, the MFI combines both metrics to show whether the market is becoming more active and efficient or slowing down and lacking conviction.
Why the MFI matters
Volume alone can be misleading. For instance, a surge in volume might seem bullish at first glance, but if the price barely moves, it indicates market indecision rather than true strength.
The MFI solves this issue by combining the price range with volume. It answers two key questions for traders:
- Is there genuine strength behind the current price movement?
- Is the market ready for a breakout or likely to reverse?
By tracking these signals, traders can identify trend continuations, spot false breakouts, detect early signs of market exhaustion, and time their entries and exits with greater precision.
Understanding the MFI color codes
Bill Williams introduced a four-color system for the MFI to make chart interpretation simple. Each candle is classified based on whether the MFI value and the trading volume increased or decreased compared to the previous candle.
1. Green bar (trend strength)
Both the MFI and volume increase. This suggests strong participation from market players and confirms the current trend. Traders often enter with the trend or add to existing positions when green bars appear.
2. Fade bar (market quietness)
Both the MFI and volume decrease. This indicates that the market is losing interest, which frequently occurs during sideways consolidation. It is usually best to stay on the sidelines or tighten stop-loss orders.
3. Fake bar (false moves)
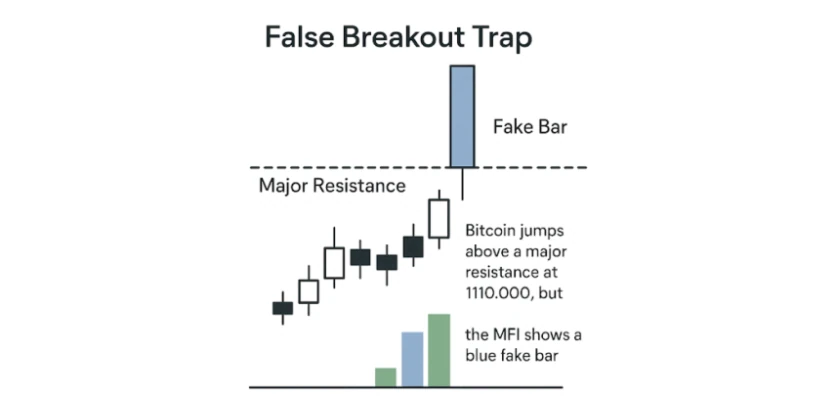
The MFI increases while volume decreases. The price is moving, but without strong volume backing. This serves as a primary warning sign of a false breakout or a market trap.
4. Squat bar (market conflict)
The MFI decreases while volume increases. Heavy volume enters the market, but the price range remains small. This signals intense fighting between buyers and sellers and often appears right before a major price breakout.
How to use the MFI in trading
To trade effectively with the MFI, you should apply a structured four-step process.
1. Identify the market context
Determine the overall trend using moving averages, trendlines, or market structure. The MFI works best when you already know whether the market is in an uptrend, a downtrend, or a range.
2. Monitor the MFI color changes
Add the MFI indicator to your charting platform and watch for color shifts as early warnings of changes in market behavior.
3. Confirm signals with price action
Wait for price action to align with the MFI bar color. For example, a green bar during a bullish breakout confirms strong buying momentum.
4. Align with support and resistance
Use key chart levels to filter signals. A fake bar at resistance suggests a bull trap, while a green bar breaking through resistance signals a valid entry.
Practical trading strategies with the MFI
Trend continuation strategy
- Identify a clear, dominant market trend.
- Look for consecutive green bars as confirmation that momentum is accelerating.
- Enter in the direction of the trend after the second green bar, placing your stop-loss order below the recent swing low.
For example, if gold (XAUUSD) is trending upward and the MFI shows three consecutive green bars, it confirms buyers are in control, making a long entry highly probable.
Breakout strategy using squat bars
- Find a tight price consolidation or chart pattern (such as a rectangle or triangle).
- A squat bar forms inside the consolidation, indicating a massive buildup of orders.
- Prepare to trade the breakout once a strong green bar follows the squat bar.
If EURUSD ranges between 1.1700 and 1.1750 and prints a squat bar, a subsequent breakout above 1.1750 with a green bar signals a strong buy setup.
False breakout trap strategy
- Watch key support or resistance levels for potential price traps.
- A fake bar occurs when the price pushes beyond a key level, but volume drops.
- Fade the move or wait for a reversal confirmation to trade in the opposite direction.
If Bitcoin pushes above resistance at $110,000 but the MFI prints a blue fake bar, it warns traders that the breakout lacks real volume, presenting a shorting opportunity.
Advantages and limitations of the MFI
Conclusion
The Market Facilitation Index is a powerful tool for analyzing the relationship between price movement and volume. By tracking its four color-coded bars, you can quickly gauge market strength, anticipate breakouts, and avoid classic market traps.
When integrated into a clear trading plan alongside proper risk management and trend analysis, the MFI helps you make objective, data-driven decisions in any financial market.


